
Solving Facebook Reach Deduplication in BigQuery
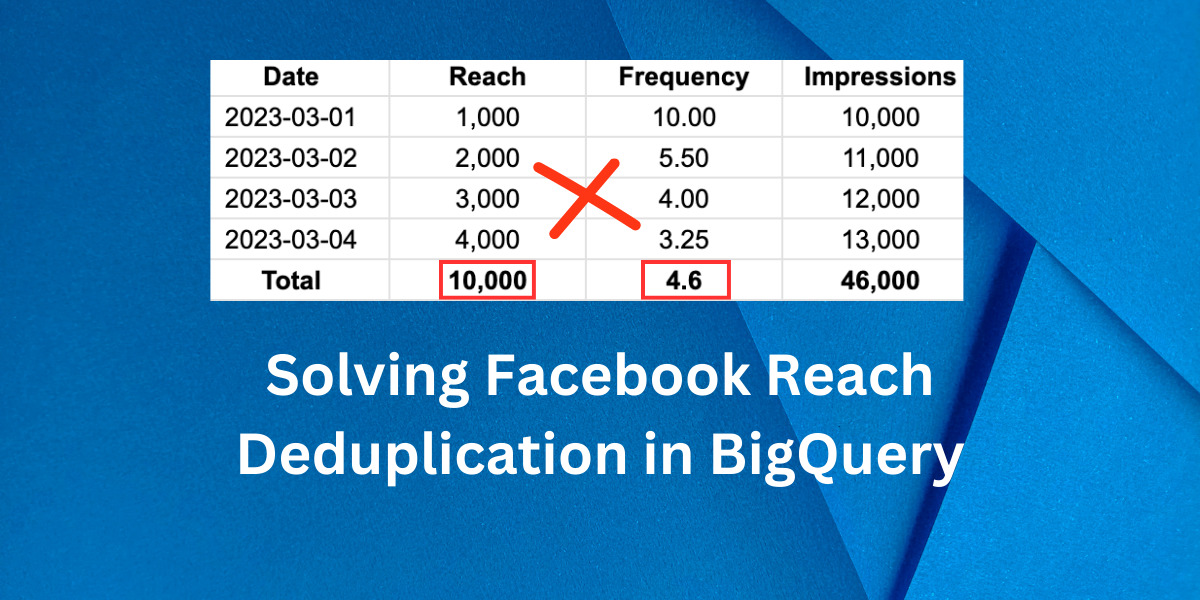
One of the unique metrics in Facebook Ads is Reach, and it works differently than other metrics. Reach is a de-duplicated metric, meaning that you might see different numbers depending on the level at which you view the data. For instance, the campaign-level Reach may not match the sum of your ad set-level Reach because Reach refers to unique users reached.
For example, suppose Ad Set 1 reached Person A and Person B, and Ad Set 2 reached Person B and Person C. Each ad set would have a Reach of 2, but the campaign’s Reach would be 3, as each person is counted only once.
The same concept applies when breaking down data by day. For instance, if a table in BigQuery contains all Facebook campaign data broken down by date, aggregating Reach will be inaccurate. In the scenario where Person A and Person B viewed the ads yesterday, and Person B and Person C viewed the same ads today, summing the total Reach would result in a count of 4, but the unique Reach here is 3. How to solve this?
The majority of Facebook Ads BigQuery connectors (if not all) only provide data broken down by account, campaign, ad set, ads, and date, making it impossible to calculate the unique reach with these dimensions. The solution is to create a Reach & Frequency pipeline with BigQuery. In this article, I will demonstrate how to structure and extract data from the Facebook Marketing API using Python.
To follow this tutorial effectively, you should have a working knowledge of Python and experience deploying pipelines with BigQuery. Covering how to build a full reporting pipeline is beyond the scope of this article.
Structure & Schema
To aggregate reach data in our reports, we cannot use the same tables we use to aggregate spend, impressions, and other metrics. Instead, we must create a dedicated table that stores only reach metrics broken down by the preferred level, such as account, campaign, ad set, or ad.
Our structure requires two date fields instead of one: a date range that contains the start and end dates of the reach results. For instance, if we want to create a reach report by campaign, the schema will resemble the following, where each Reach value is accompanied by its precise date range. In this case, we can ensure that there is no deduplication and that we have a complete count of unique reach.
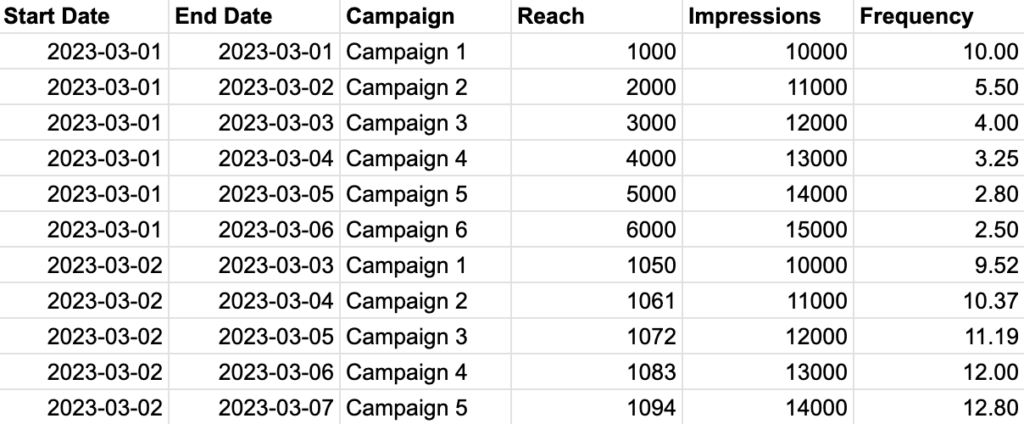
To ensure accurate data aggregation, we must modify our SQL query to filter by not only the date field but also by two additional keys: the start and end dates. As a result, the final schema of our campaign reach table will include the following fields:
• start_date
• end_date
• campaign
• reach
• frequency
• impressions
Generating Date Ranges
To pull the reach report from the Facebook Ads API for a specific date range, we need to generate all possible date range variations within that range. For instance, if we want to retrieve the reach report from 2023-03-01 to 2023-03-03, we would need to generate six possible date range variations:
2023-03-01 : 2023-03-01
2023-03-01 : 2023-03-02
2023-03-01 : 2023-03-03
2023-03-02 : 2023-03-02
2023-03-02 : 2023-03-03
2023-03-03 : 2023-03-03
To accomplish this, we can create a Python function that dynamically generates all possible date ranges. This function should take a start and end date as inputs and return a list of date range variations that we can pass to the Facebook Ads API.
from datetime import timedelta

def get_all_date_ranges(start_date_range, end_date_range):
    '''
    This function generate all possible date ranges.

    Args:
        start_date_range (datetime.date): Start date for date range
        end_date_range (datetime.date): End date for date range

    Returns:
        date_ranges (list): List of date ranges
    '''

    date_range = (end_date_range - start_date_range).days + 1
    end_date_range = end_date_range + timedelta(days=1)

    # Generate all possible date ranges
    date_ranges = []
    for i in range(0, date_range):
        start_date = end_date_range - timedelta(days=i+1)
        new_range = (end_date_range - start_date).days
        for j in range(0, new_range):
            end_date = str(start_date + timedelta(days=j))
            date_ranges.append(
                str(start_date)+'_'+str(end_date)
            )
    return date_ranges
Calling Facebook Ads API
Thankfully, Facebook Ads API allows us to pass a list of date ranges instead of making separate API calls for each range. We can use the ‘time_ranges’ parameter key to specify the date ranges. This parameter accepts an array of time-range objects. Time ranges can overlap, allowing us to retrieve cumulative insights. Each time range will have one result set. The format for a time range object is {‘since’: YYYY-MM-DD, ‘until’: YYYY-MM-DD}.
To make the API request in Python, we need to have the Facebook Business PIP package installed. Here’s an example function to make the API call, which will use the date ranges generated earlier:
from facebook_business.adobjects.adaccount import AdAccount
from facebook_business.api import FacebookAdsApi
import time


def request_reporting_data_async(access_token, account_id, start_date, end_date):

    # Initialize the FacebookAdsApi class
    FacebookAdsApi.init(access_token=access_token, api_version='v15.0')

    # Get the account for which we want to request data
    my_account = AdAccount('act_'+account_id)

    # Get all the date ranges for which we want to request data
    date_ranges = get_all_date_ranges(
        start_date_range=start_date, end_date_range=end_date)
    print(f'Number of unique date ranges to fetch: {len(date_ranges)}')

    # Convert to list of dicts
    date_ranges_dict_list = []
    for date_range in date_ranges:
        date_ranges_dict_list.append(
            {'since': date_range.split('_')[0], 'until': date_range.split('_')[1]})

    # Define the parameters for the request
    params = {
        'level': 'campaign',
        'time_ranges': date_ranges_dict_list,
    }

    # Define the fields for the request
    fields = [
        'campaign_name',
        'campaign_id',
        'date_start',
        'date_stop',
        'reach',
        'frequency',
        'impressions',
    ]

    # Send the request
    async_job = my_account.get_insights(
        fields=fields, params=params, is_async=True)

    # Get the response
    async_job.api_get()

    # Define the number of trials to try and get the data
    trials = 1
    num_of_trials = 3
    sleep_time = 10

    # Check the status of the response
    while async_job['async_status'] != 'Job Completed' and trials <= num_of_trials:
        print('Facebook reporting status: '+async_job['async_status'])
        if async_job['async_status'] == 'Job Failed':
            print(async_job)
            print('Facebook job failed, this is trial number: '+str(trials))
            time.sleep(10)
            async_job = my_account.get_insights(
                fields=fields, params=params, is_async=True)
            trials += 1
        time.sleep(sleep_time)
        sleep_time += 5
        async_job.api_get()

    # Get the data
    data = async_job.get_result()

    # Return the data
    return data
When working with a Facebook account with many campaigns, it’s best to avoid pulling data for a period exceeding 90 days. Doing so could cause Facebook’s job to fail. Feel free also to create different tables for other levels like adset, ads..etc.
After retrieving the data, you can upload it to BigQuery. However, building the entire pipeline is beyond the scope of this tutorial. Once the data is in BigQuery, you can proceed to the next step and learn how to retrieve it in Looker Studio.
Connecting to Looker Studio
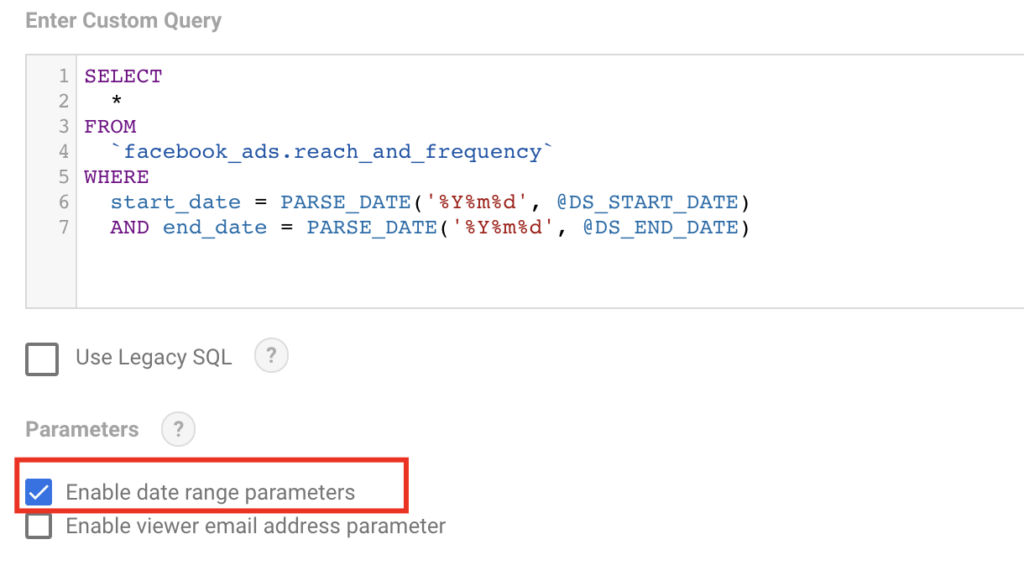
When pulling BigQuery data in Looker Studio, our SQL query needs to be adjusted because Looker Studio’s default Date Picker does not allow selecting multiple date fields. To solve this, we can use Date parameters in our query. Looker Studio provides two parameters we can use in our custom query: @DS_START_DATE and @DS_END_DATE. This means that our query in the Looker Studio BigQuery connector will need to be modified to incorporate these parameters. Here’s an example of what the modified query could look like:
SELECT
  *
FROM
  `facebook_ads.reach_and_frequency`
WHERE
  start_date = PARSE_DATE('%Y%m%d', @DS_START_DATE)
  AND end_date = PARSE_DATE('%Y%m%d', @DS_END_DATE)
Make sure to tick ‘Enable date range parameters’ as seen in the screenshot:
Finally, when you select a date range in Looker Studio’s Date Range Picker, the data displayed will change based on the start and end dates specified in the query.

Entrepreneur focused on building MarTech products that bridge the gap between marketing and technology. Check out my latest products Markifact, Marketing Auditor & GA4 Auditor – discover all my products here.