

Data Blending in Google Data Studio – Practical Guide
Data blending in Data Studio let you combine multiple data sources into a single chart or visualization, called blended data source. Data blending brings in additional information from a secondary data source and displays it with data from the primary data source directly in the view. Blending saves time and removes the need to manipulate the data in external tools, as you can directly blend charts in Google Data Studio.
A good example of data blending in Googe Data Studio is when you want to blend data from Google Analytics and Facebook Ads so you can combine the traffic metrics with the ads metrics in a single dashboard.
How data blending in Data Studio works
To join multiple data sources, each source in the blend must share a common dimension known as join key. Blended data sources include all the records from the leftmost data source in the Blend Data and the records from the data sources to the right that share the same values across the join key. And this operation called left outer join.
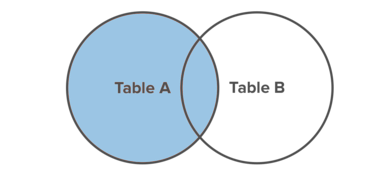
The LEFT JOIN merges all records from the left table (table A), and the matching records from the right table (table B). The result is 0 records from the right side if there is no match. The diagram above illustrates a left outer join of data sources A and B. The blended data source includes all the records contained by the blue circle.
How to blend data in Google Data Studio
Have you ever wanted to combine data from Google Analytics and Facebook Ads into a single source? In, this article, we will show an example of combining Google Analytics traffic data with Facebook Ads data.
Prerequisites
- Google Analytics data source in Data studio, you may use the free connector.
- Facebook Ads data source in Data studio, you may use any of the community connetors or Google sheets. We have a free solution here on how to import Facebook Ads data into Google Sheets.
- You must be passing the campaign name or ids from Facebook to Google Analytics in the UTMs, as this will be our join key.
To demonstrate the data blending between the two sources – Google Analytics and Facebook Ads. I created the 2 tables below that we will need to combined into one table.
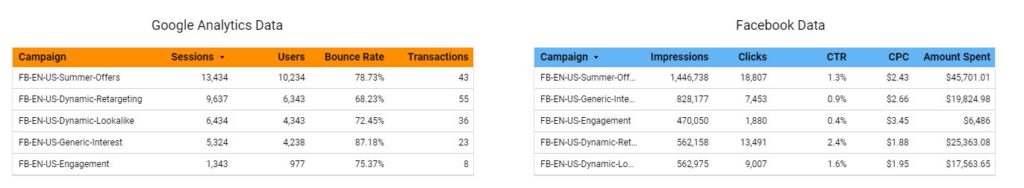
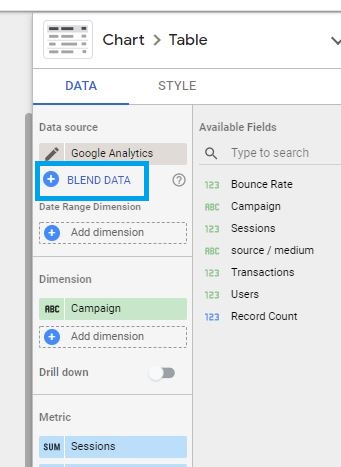
Our Join Key in that case is Campaign. To get started and blend the 2 tables into one table. Click on the Google Analytics table then pick Blend Data under the Google Analytics source which should be now our left table on the joint.
Click Add Another Data Source to select the Facebook Data source.
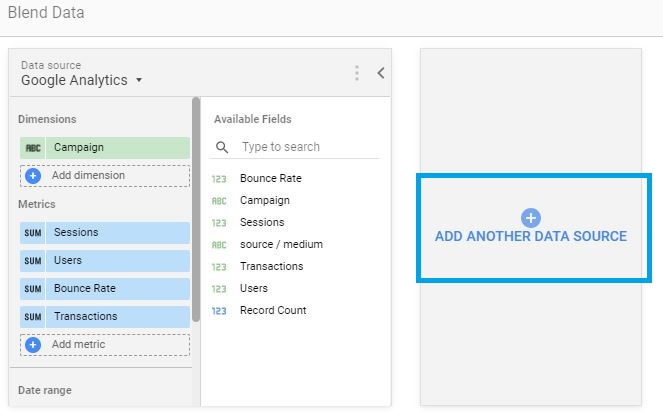
Make sure to have ‘Campaign’ in the join key field for both data sources. The join key name may be different from a source to a source, however, the values should be the same in order for a match to happen.
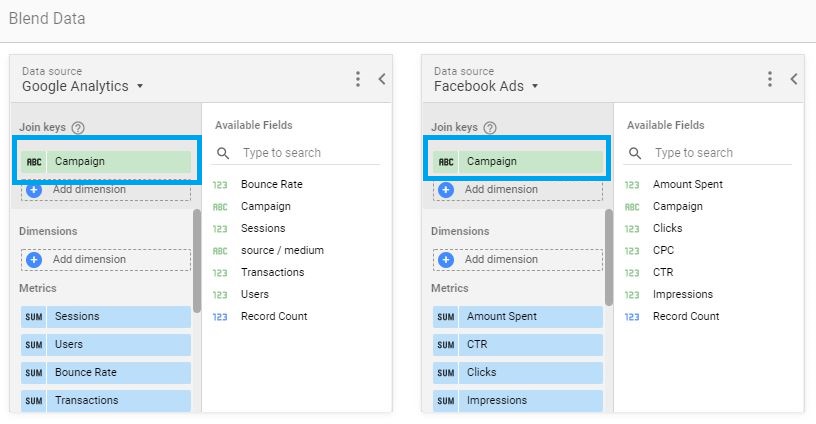
Make sure to drag and drop the metrics and dimensions you’d like to see in your blended source. Your blended source should have all the common values and you can use it to create more visualizations.
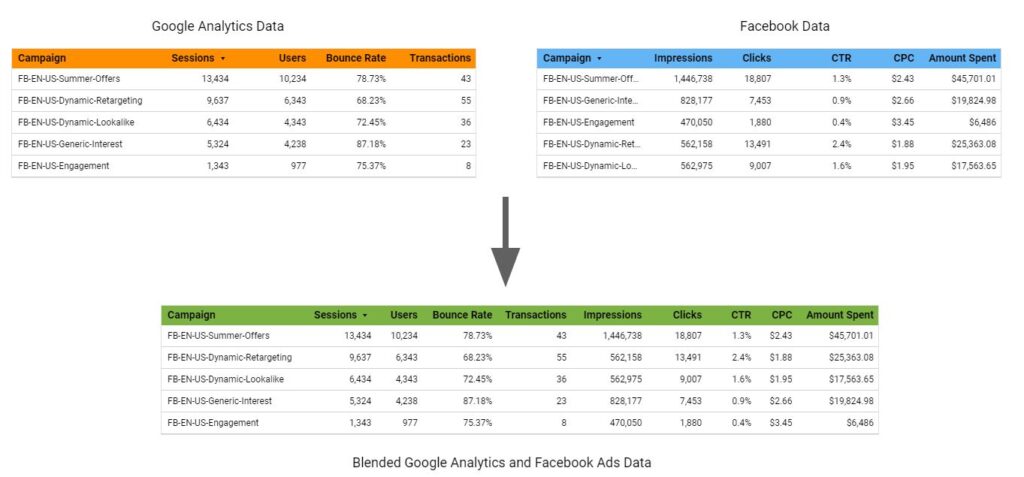
After blending your data, you may end up having a table where some columns have similar names. You can easily edit those names in order to differentiate between the different sources schema.
Please note that you can blend up to 4 other data sources. You can also use multiple join keys Each data source in the blend must have the same set of dimensions used in the key.
Manage blended data sources
Blended data sources are listed in the DATA tab of the Properties panel, under Component Data Sources.
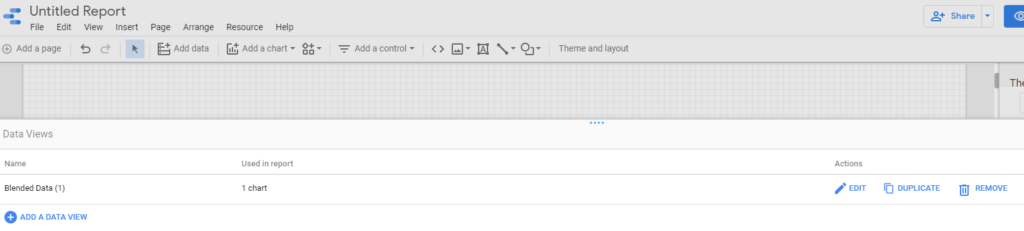
You can check the status of and remove blended data sources using the Resources > Manage blended data menu. Removing a blended data source will break all dependant charts, but will not remove the underlying data sources themselves. Any data sources you’ve added will still be attached to the report.

Entrepreneur focused on building MarTech products that bridge the gap between marketing and technology. Check out my latest products Markifact, Marketing Auditor & GA4 Auditor – discover all my products here.