

Detecting and Classifying Bot Traffic in GA4 with BigQuery ML
Bot traffic is a common problem for website owners, as it can skew analytics data and misrepresent user behavior. Bots can be used for various purposes, including web scraping, spamming, and click fraud, among others. In order to accurately analyze user behavior and make data-driven decisions, it is essential to detect and classify bot traffic in Google Analytics 4 (GA4). However, traditional methods for identifying bots can be time-consuming, labor-intensive, and prone to errors. In this article, we will explore how BigQuery ML can be used to detect and classify bot traffic in GA4 efficiently. Whether you’re a beginner or an experienced GA4 user, this article will provide a comprehensive guide to detecting and categorizing bot traffic with BigQuey ML models.
Before we begin, there are a few prerequisites you need to follow this guide:
- GA4 BigQuery export: You need to have a GA4 BigQuery dataset. In case you haven’t created one yet, you can link GA4 to BigQuery following this guide
- No SQL knowledge required: Don’t worry if you don’t have any SQL knowledge. We’ll provide you with the code you need to run in BigQuery. Additionally, we’ll be using GA4 SQL, a tool we’ve built that allows you to generate BigQuery queries through a user interface, without requiring any SQL knowledge.
Here are the sections we will cover in this article:
- Identify bot traffic through demographic and behavioral data
- Train a BigQuery ML classification model with the labeled bot traffic.
- Evaluate the model using statistical measures such as precision, recall, and F1 score.
- Make predictions using the trained model.
- Utilize predictions to take action against bot traffic.
1- Identify & Label Bot Traffic
In order to accurately detect and classify bot traffic in GA4 using BigQuery ML, we first need to identify patterns in the data that indicate bot activity. Two main types of data can help us with this task: demographic and behavioral data.
Behavioral Data
While some bots can be difficult to distinguish from real users, certain behavioral metrics can help identify unusual interactions that are common to bot traffic. Based on my experience, the following metrics have proven to be effective in detecting and classifying bot traffic. However, you can still add any other metric that you think would be useful for your specific case.
- Engagement time: Bots tend to have shorter engagement times compared to human users, usually less than one second.
- New user ratio: A high ratio of new users may indicate bot traffic, as bots often don’t store cookies.
- Sessions per user: Advanced bots, especially price-scraping bots, often have a high number of sessions per user, as they store cookies to imitate user behavior. They may have an unusually high number of sessions per day, such as 50 or more.
- Transactions: Bots typically don’t make purchases on your website. If your website isn’t an e-commerce site, you can choose any macro-conversion, such as a subscription.
Demographic Data
Along with behavioral patterns, bots typically exhibit specific demographic characteristics that remain consistent. These characteristics are related to the servers where the bots are hosted, such as the data center location, country, city, and even the time they are scheduled to execute. Some of the key dimensions
- Country: If you notice traffic coming from countries that are not your target market, it could be a sign of bot traffic. For example, if your website is targeted at a French audience, and you see a lot of traffic from the United States, it’s likely to be bot traffic.
- City: Similar to the country, if you notice traffic coming from cities that are not your target audience, it could also be bot traffic. Additionally, some bots may not provide any city information and will show up as “(not set)” in your analytics.
- Device: While bots can use any device, they tend to execute their tasks on desktop computers. However, this is not always the case, so it should be used in combination with other metrics.
- Operating System: Bots are typically hosted on virtual machines running on Linux or Windows. However, this is not always the case, and you should use other metrics to verify if traffic is bot traffic.
- Browser: Bots tend to use older browser versions, so if you notice traffic from older browser versions that are not common among your human visitors, it could be a sign of bot traffic. However, this metric should also be used in conjunction with other metrics to confirm bot traffic.
It’s important to note that while demographic data can be helpful in identifying bot traffic, it’s not enough on its own. It should be used in combination with other metrics, such as behavioral data, to get a more accurate picture.
Now that we have our checklist for identifying bot traffic in GA4, we can start examining our GA4 dataset to find segments that fit the criteria. We will be using BigQuery to explore the data and look for these segments. However, you can also use other tools like the GA4 Explore Report or Looker Studio to run the analysis. Our main goal is to identify segments that meet the bot traffic criteria we established earlier.
To extract the dimension and metrics in our list, I will use the SQL Query below, which I generated using GA4 SQL, of course, you can also create your own query. For training purposes, I’ll be using data from the first three months of the year, and for model evaluation, I’ll use April‘s data. Consequently, I’ll be using a table suffix that spans from January through March.
/* This query is generated by ga4Sql.com */
SELECT
  country,
  city,
  operating_system_version,
  browser,
  browser_version,
  COUNT(DISTINCT user_pseudo_id) AS total_users,
  COUNT(DISTINCT new_users) AS new_users,
  COUNT(DISTINCT new_users) / COUNT(DISTINCT user_pseudo_id) as new_users_percentage,
  SAFE_DIVIDE(
    SUM(engagement_time_seconds),
    COUNT(DISTINCT session_id)
  ) AS average_engagement_time_per_session,
  SAFE_DIVIDE(
    COUNT(DISTINCT session_id),
    COUNT(DISTINCT user_pseudo_id)
  ) AS sessions_per_user,
  SUM(purchases) AS purchases,

FROM
  (
    SELECT
      geo.country AS country,
      geo.city AS city,
      device.operating_system_version AS operating_system_version,
      device.web_info.browser AS browser,
      device.web_info.browser_version AS browser_version,
      SAFE_DIVIDE(
        SUM(
          (
            SELECT
              value.int_value
            FROM
              UNNEST (event_params)
            WHERE
              key = 'engagement_time_msec'
          )
        ),
        1000
      ) AS engagement_time_seconds,
      CONCAT(
        user_pseudo_id,
        (
          SELECT
            value.int_value
          FROM
            UNNEST (event_params)
          WHERE
            key = 'ga_session_id'
        )
      ) AS session_id,
      user_pseudo_id,
      SUM(
        CASE
          WHEN event_name = 'purchase' THEN 1
          ELSE 0
        END
      ) AS purchases,
      MAX(
        CASE
          WHEN event_name = 'first_visit' THEN user_pseudo_id
          ELSE NULL
        END
      ) AS new_users
    FROM
      `analytics_258822732.events_*`
    WHERE
      _TABLE_SUFFIX BETWEEN '20230101' AND '20230331'
    GROUP BY
      country,
      city,
      operating_system_version,
      browser,
      browser_version,
      session_id,
      user_pseudo_id
  )
GROUP BY
  country,
  city,
  operating_system_version,
  browser,
  browser_version
Order by total_users desc
After running the query you should scan through the dataset to find segments that meet the criteria above so we can use them in our training dataset, here are some findings in my dataset. The dataset, I am using it for my blog, so I don’t have purchases. If your data is too sparse, you may want to consider setting a labeling threshold, such as 100 users. The appropriate threshold will depend on the size of your website.
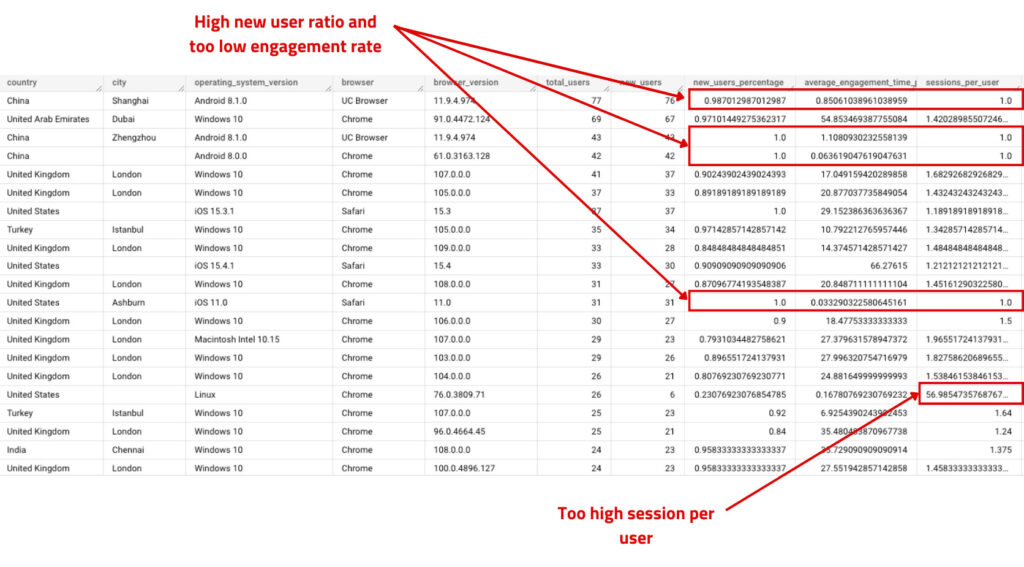
After analyzing my GA4 data using BigQuery, I identified certain user segments that match the bot traffic criteria we established earlier. For instance, I found some segments with a 100% new user rate and very low engagement time. In another segment, there were a suspiciously high number of sessions per user (57 sessions). You will need to review your own dataset and look for similar patterns to identify potential bot traffic. Once you find a segment that meets the criteria, make note of the relevant dimensions, for example, I would label users from China using Android 8.10, UC Browser, and browser version 11.9.4.874 as bot traffic.
Labeling the dataset
To label our dataset, we created a new field called is_bot with two possible values: 1 for “bot” and 0 for “non-bot”. We used a CASE WHEN statement in our SQL query to accomplish this. To automate the labeling process, I exported the dataset from BigQuery to CSV and utilized Excel. I only labeled segments that had more than 10 users, but you may choose a different threshold depending on the size of your website.
Here’s the Excel formula I used:
="when country = '"&A2&"' and "&" city = '"&B2&"' and "&" operating_system_version = '"&C2&"' and "&" browser = '"&D2&"' and "&" browser_version = '"&E2&"' then 1 "
And here are the segments that I labeled as bot traffic:
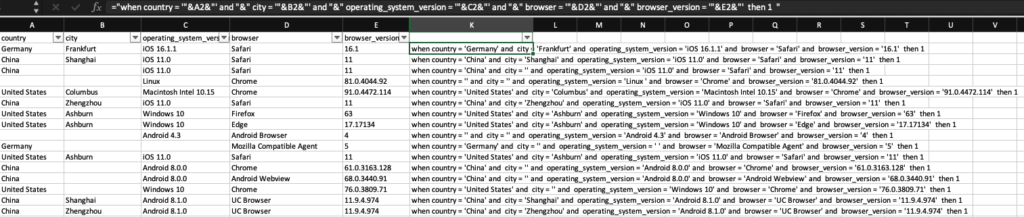
This is the complete query with the newly added is_bot field and the inclusion of the user_pseudo_id column. We added the latter as we plan to train the model at the user level.
/* This query is generated by ga4Sql.com */
CREATE VIEW `views.bot_traffic`
AS
SELECT
  user_pseudo_id,
  case
    when country = 'Germany' and  city = 'Frankfurt' and  operating_system_version = 'iOS 16.1.1' and  browser = 'Safari' and  browser_version = '16.1'  then 1
    when country = 'China' and  city = 'Shanghai' and  operating_system_version = 'iOS 11.0' and  browser = 'Safari' and  browser_version = '11'  then 1
    when country = 'China' and  city = '' and  operating_system_version = 'iOS 11.0' and  browser = 'Safari' and  browser_version = '11'  then 1
    when country = '' and  city = '' and  operating_system_version = 'Linux ' and  browser = 'Chrome' and  browser_version = '81.0.4044.92'  then 1
    when country = 'United States' and  city = 'Columbus' and  operating_system_version = 'Macintosh Intel 10.15' and  browser = 'Chrome' and  browser_version = '91.0.4472.114'  then 1
    when country = 'China' and  city = 'Zhengzhou' and  operating_system_version = 'iOS 11.0' and  browser = 'Safari' and  browser_version = '11'  then 1
    when country = 'United States' and  city = 'Ashburn' and  operating_system_version = 'Windows 10' and  browser = 'Firefox' and  browser_version = '63'  then 1
    when country = 'United States' and  city = 'Ashburn' and  operating_system_version = 'Windows 10' and  browser = 'Edge' and  browser_version = '17.17134'  then 1
    when country = '' and  city = '' and  operating_system_version = 'Android 4.3' and  browser = 'Android Browser' and  browser_version = '4'  then 1
    when country = 'Germany' and  city = '' and  operating_system_version = ' ' and  browser = 'Mozilla Compatible Agent' and  browser_version = '5'  then 1
    when country = 'United States' and  city = 'Ashburn' and  operating_system_version = 'iOS 11.0' and  browser = 'Safari' and  browser_version = '11'  then 1
    when country = 'China' and  city = '' and  operating_system_version = 'Android 8.0.0' and  browser = 'Chrome' and  browser_version = '61.0.3163.128'  then 1
    when country = 'China' and  city = '' and  operating_system_version = 'Android 8.0.0' and  browser = 'Android Webview' and  browser_version = '68.0.3440.91'  then 1
    when country = 'United States' and  city = '' and  operating_system_version = 'Windows 10' and  browser = 'Chrome' and  browser_version = '76.0.3809.71'  then 1
    when country = 'China' and  city = 'Shanghai' and  operating_system_version = 'Android 8.1.0' and  browser = 'UC Browser' and  browser_version = '11.9.4.974'  then 1
    when country = 'China' and  city = 'Zhengzhou' and  operating_system_version = 'Android 8.1.0' and  browser = 'UC Browser' and  browser_version = '11.9.4.974'  then 1
  else 0 end as is_bot,

  country,
  city,
  operating_system_version,
  browser,
  browser_version,
  COUNT(DISTINCT user_pseudo_id) AS total_users,
  COUNT(DISTINCT new_users) AS new_users,
  COUNT(DISTINCT new_users) / COUNT(DISTINCT user_pseudo_id) as new_users_percentage,
  SAFE_DIVIDE(
    SUM(engagement_time_seconds),
    COUNT(DISTINCT session_id)
  ) AS average_engagement_time_per_session,
  SAFE_DIVIDE(
    COUNT(DISTINCT session_id),
    COUNT(DISTINCT user_pseudo_id)
  ) AS sessions_per_user,
  SUM(purchases) AS purchases,

FROM
  (
    SELECT
      geo.country AS country,
      geo.city AS city,
      device.operating_system_version AS operating_system_version,
      device.web_info.browser AS browser,
      device.web_info.browser_version AS browser_version,
      SAFE_DIVIDE(
        SUM(
          (
            SELECT
              value.int_value
            FROM
              UNNEST (event_params)
            WHERE
              key = 'engagement_time_msec'
          )
        ),
        1000
      ) AS engagement_time_seconds,
      CONCAT(
        user_pseudo_id,
        (
          SELECT
            value.int_value
          FROM
            UNNEST (event_params)
          WHERE
            key = 'ga_session_id'
        )
      ) AS session_id,
      user_pseudo_id,
      SUM(
        CASE
          WHEN event_name = 'purchase' THEN 1
          ELSE 0
        END
      ) AS purchases,
      MAX(
        CASE
          WHEN event_name = 'first_visit' THEN user_pseudo_id
          ELSE NULL
        END
      ) AS new_users

    FROM
      `analytics_258822732.events_*`
    WHERE
      _TABLE_SUFFIX BETWEEN '20230101' AND '20230331'

    GROUP BY
      country,
      city,
      operating_system_version,
      browser,
      browser_version,
      session_id,
      user_pseudo_id
  )
GROUP BY
  user_pseudo_id,
  is_bot,
  country,
  city,
  operating_system_version,
  browser,
  browser_version
2- Train BigQuery ML
After completing our training dataset, the next step is to train the model using binary logistic regression since our data falls into two categories: 1 for bot and 0 for not bot. To train the model, we need to run the following query. Make sure to create a new dataset called models where we will export the trained model.
CREATE OR REPLACE MODEL models.bot_traffic_logreg

OPTIONS(
  MODEL_TYPE="LOGISTIC_REG",
  INPUT_LABEL_COLS=["is_bot"]
) AS

SELECT
  *
FROM
  views_bot_traffic
The training process for the model should take a few minutes, depending on the size of your dataset.
3- Evaluate the Model
After the model finishes training, the next step is to evaluate its performance using ML.EVALUATE. This will provide us with a list of metrics that we can use to determine if our model is effective or not.
SELECT
  *
FROM
  ML.EVALUATE(MODEL `models.bot_traffic_logreg`)
After running the evaluate query, you should be able to see such results:
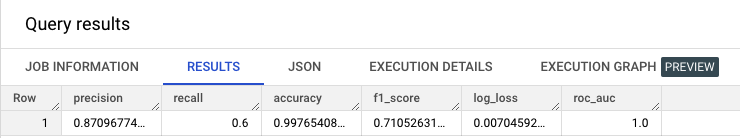
Here’s the explanation for each metric:
- Precision: Precision is the ratio of true positive results to the total predicted positive results. In the context of bot traffic, precision would mean how accurately the model predicted the bot traffic compared to the total predicted traffic. For example, if the model predicted that there were 100 bot traffic sessions and 87 of them were actually bot traffic, the precision of the model would be 87%.
- Recall: Recall is the ratio of true positive results to the total actual positive results. In the context of bot traffic, recall would mean how well the model is able to identify all the actual bot traffic sessions. For example, if there were actually 150 bot traffic sessions in the dataset and the model correctly identified 100 of them, the recall of the model would be 67%.
- Accuracy: Accuracy is the overall correct prediction rate of the model. In the context of bot traffic, accuracy would mean how well the model is able to correctly predict all traffic sessions, both bot and non-bot. In our case, we have great accuracy of 99%.
- F1-score: F1-score is the harmonic mean of precision and recall. It takes into account both precision and recall to provide a balanced evaluation of the model’s performance. For example, if the precision of the model is 80% and the recall is 60%, the F1-score of the model would be 68%.
- Log loss: Log loss is the measure of the performance of a classification model where the predicted output is a probability value between 0 and 1. In the context of bot traffic, log loss would measure how well the model is able to predict the probability of a session being bot traffic or not. Lower log loss values indicate better performance.
- ROC AUC: ROC AUC (Receiver Operating Characteristic – Area Under the Curve) is a metric that measures the ability of a model to distinguish between positive and negative classes. It plots the true positive rate (TPR) against the false positive rate (FPR) at different classification thresholds. For bot traffic, the ROC AUC would measure the ability of the model to distinguish between bot traffic and non-bot traffic. A higher ROC AUC value indicates better performance.
4- Make predictions using BigQuery ML
Now it’s time for the much-awaited part, which is making predictions. We used ML.PREDICT to generate predictions based on the ideal model that we developed. As mentioned earlier, we trained the model on the data from the first three months of the year and will use the April data for predictions.
The query for prediction should be straightforward, consisting of two parts: the first part for prediction, and the second part for the April dataset we want to predict.
SELECT
  user_pseudo_id,
  predicted_is_bot,
  CASE
    WHEN predicted_is_bot = 0 THEN predicted_is_bot_probs[OFFSET(1)].prob
    WHEN predicted_is_bot = 1 THEN predicted_is_bot_probs[OFFSET(0)].prob
  END AS probability

FROM
  ML.PREDICT(MODEL views.bot_traffic_logreg,
    (
    SELECT
      user_pseudo_id,
      country,
      city,
      operating_system_version,
      browser,
      browser_version,
      COUNT(DISTINCT user_pseudo_id) AS total_users,
      COUNT(DISTINCT new_users) AS new_users,
      COUNT(DISTINCT new_users) / COUNT(DISTINCT user_pseudo_id) AS new_users_percentage,
      SAFE_DIVIDE( SUM(engagement_time_seconds), COUNT(DISTINCT session_id) ) AS average_engagement_time_per_session,
      SAFE_DIVIDE( COUNT(DISTINCT session_id), COUNT(DISTINCT user_pseudo_id) ) AS sessions_per_user,
      SUM(purchases) AS purchases,
    FROM (
      SELECT
        geo.country AS country,
        geo.city AS city,
        device.operating_system_version AS operating_system_version,
        device.web_info.browser AS browser,
        device.web_info.browser_version AS browser_version,
        SAFE_DIVIDE( SUM( (
            SELECT
              value.int_value
            FROM
              UNNEST (event_params)
            WHERE
              KEY = 'engagement_time_msec' ) ), 1000 ) AS engagement_time_seconds,
        CONCAT( user_pseudo_id, (
          SELECT
            value.int_value
          FROM
            UNNEST (event_params)
          WHERE
            KEY = 'ga_session_id' ) ) AS session_id,
        user_pseudo_id,
        SUM(
          CASE
            WHEN event_name = 'purchase' THEN 1
          ELSE
          0
        END
          ) AS purchases,
        MAX(
          CASE
            WHEN event_name = 'first_visit' THEN user_pseudo_id
          ELSE
          NULL
        END
          ) AS new_users
      FROM
        `analytics_258822732.events_*`
      WHERE
        _TABLE_SUFFIX BETWEEN '20230401'
        AND '20230430'
      GROUP BY
        country,
        city,
        operating_system_version,
        browser,
        browser_version,
        session_id,
        user_pseudo_id )
    GROUP BY
      user_pseudo_id,
      country,
      city,
      operating_system_version,
      browser,
      browser_version ))
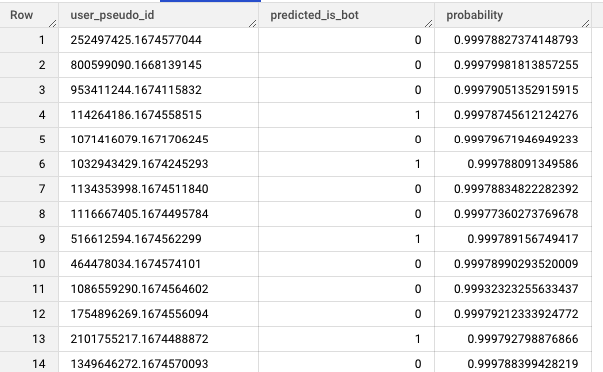
The output of the query should display the values for predicted_is_bot label, where the value of 0 indicates “no” and the value of 1 indicates “yes”. Additionally, for each user, the query should also display the corresponding probability for each user. You can set a threshold, such as 80%, to determine whether a particular user is a bot or not.
There are many ways now you can leverage the model results:
- Create filters to exclude user IDs identified as bots from your reporting framework
- Run an analysis to further investigate bot traffic and understand its impact on overall website performance.
- Use the results to inform future strategies and efforts to mitigate bot traffic.
- Compare bot traffic data across different time periods to track trends and changes.
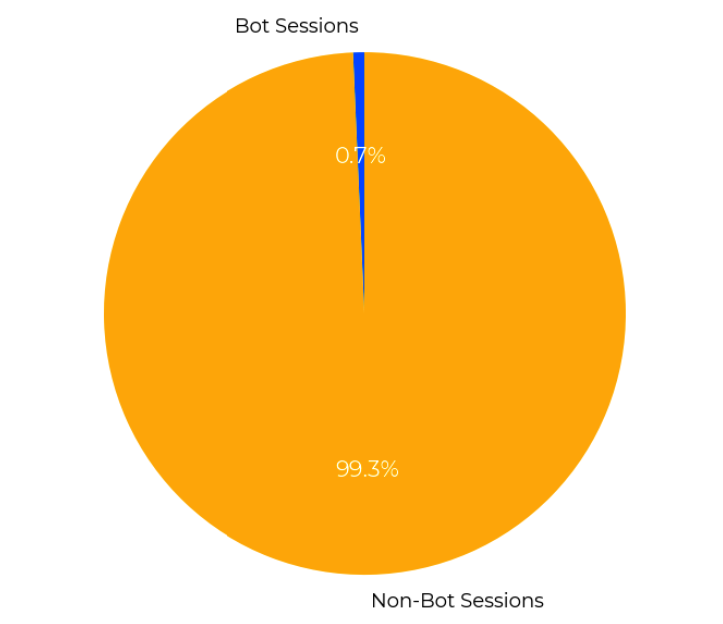
After aggregating the session traffic for each user based on the predicted results, here are the ML results for my blog in April:

Entrepreneur focused on building MarTech products that bridge the gap between marketing and technology. Check out my latest products Markifact, Marketing Auditor & GA4 Auditor – discover all my products here.