Advanced Performance Forecasting Techniques
Forecasting is a key element in conducting your performance media plans and campaigns’ success, before we explain how to forecast, we have to understand what regression analysis is. Regression analysis according to Wikipedia is a statistical process for estimating the relationships among variables. It allows us to make predictions about future outcomes by estimating the relationship between two variables, where we can utilize what happened in the past to predict what can happen in the future.
To run a regression analysis, we need two things:-
1- Dependent variable
2- Independent Variable
In this article, we will be using the traffic (Independent Variable) to forecast the revenue (Dependent variable). In general, the independent variable is the cause and the dependent variable is the effect.
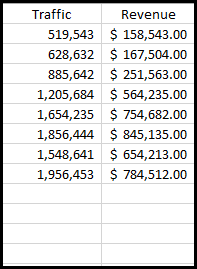
The first thing we have to do is to determine if there is a correlation between our variables. Correlation is a statistical measure that indicates the extent to which two or more variables fluctuate together. In other words, it measures how two variables change in relation to each other. In our example, we want to determine the nature of the relationship between traffic and revenue. On of the easiest way is to use is excel:-
CORREL Excel Formula
Through excel you can calculate the correlation between two variables using the CORREL function. The syntax of the formula is CORREL(ARRAY1, ARRAY2)
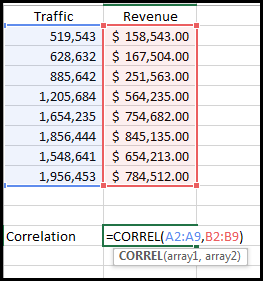
So, the correlation between the traffic and the revenue in our case is:- 0.96
If the number is closer to 1, it means there is a strong relationship between the two data sets. If the number is close to 0, it means there is no or weak relationship between the two variables or in other words the relation between the two variables is Zero. So, in our case, the number is so close to 1 which means that there is a strong positive correlation between the traffic and revenue.
Create a Scatter Chart
Plot the independent variable on the x-axis (traffic) and the dependent variable on the y-axis (revenue).
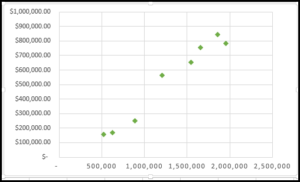
Find the best trend line
This step is really important, because if you pick the wrong trend line, your forecast won’t be accurate. After you made the scatter chart you need now a line to connect these dots. Right click on your data point and select “ Add Trendline”
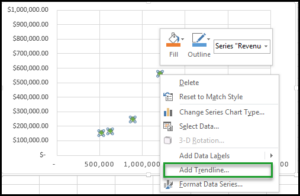
There are many types of trend line as you can see:-
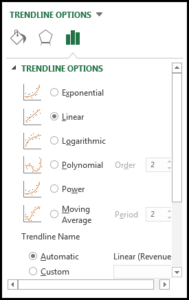
To figure out which one fits your data, we have to calculate R2 or the coefficient of determination which is a number from 0 to 1 that describes how well a regression line fits a data set. In our case, it tells us how well traffic can predict revenue. If the number is closer to 0, traffic is not a good predictor of revenue. If the number is closer to 1, traffic is a good predictor of revenue. To display R2, please see below:-
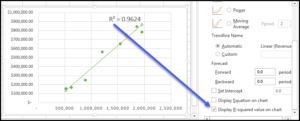
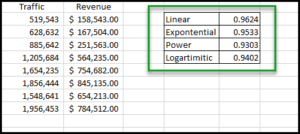
Now you have to repeat the step for each line type till you know which line has the highest R2 value. In our example, the linear trend line has the highest R2 value which means it’s the best fit for our forecast.
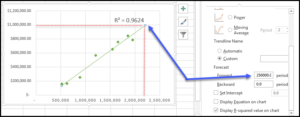
Now to begin forecasting, select the type of trendline that has the highest R2 value and then you need to insert in the forward section (of your trendline option) the number of periods into the future for which you want to forecast values.
Summary
Forecasting is not just guessing. It involves use of certain data which becomes useful information through statistical process. Effective planning, budgeting and forecasting are important skills that help organizations maximize revenues, manage costs and projects. And one of the best forecasting techniques available is regression that you need to get the hang of it.

Entrepreneur focused on building MarTech products that bridge the gap between marketing and technology. Check out my latest products Markifact, Marketing Auditor & GA4 Auditor – discover all my products here.

This paragraph is really a fastidious one it assists new the web viewers, who are wishing in favor of blogging.
Outstanding post however , I was wanting to know if you could write a litte more on this subject? I’d be very thankful if you could elaborate a little bit further. Thanks!
Pretty nice post. I just stumbled upon your weblog and wanted to say that I’ve really enjoyed surfing around your blog posts. In any case I will be subscribing to your rss feed and I hope you write again very soon!
I don’t believe these numbers.
This is pure lies.
CC me in your next post.